One of the first things I needed was a way to see what the boat is actually doing — in real time, from anywhere. Not just GPS coordinates, but sensor readings, battery voltage, wind data, system status. All of it. So I built a dashboard that runs on the Raspberry Pi and serves a live web interface accessible through the Cloudflare tunnel.
The Problem
ArduPilot and Pixhawk give you telemetry, but it's designed for short-range RC use. I needed something that works over satellite, survives connection dropouts gracefully, and gives me a full picture of both the navigation system and the science sensors at the same time. No existing solution did exactly that, so I wrote one.
Stack
The whole thing runs on the Pi in Python. The backend is Flask — lightweight, easy to run as a systemd service, no overhead. It connects to Pixhawk over MAVLink using pymavlink, reads I2C sensors directly via smbus2, and serves everything as a JSON API. The frontend polls that API every few seconds and updates the page without reloading.
# Core loop — simplified
from flask import Flask, jsonify
from pymavlink import mavutil
import smbus2

app = Flask(__name__)
connection = mavutil.mavlink_connection('/dev/ttyAMA0', baud=57600)

@app.route('/api/status')
def status():
    msg = connection.recv_match(type='GPS_RAW_INT', blocking=True)
    return jsonify({
        'lat': msg.lat / 1e7,
        'lon': msg.lon / 1e7,
        'fix': msg.fix_type,
        'sats': msg.satellites_visible
    })
What it Shows
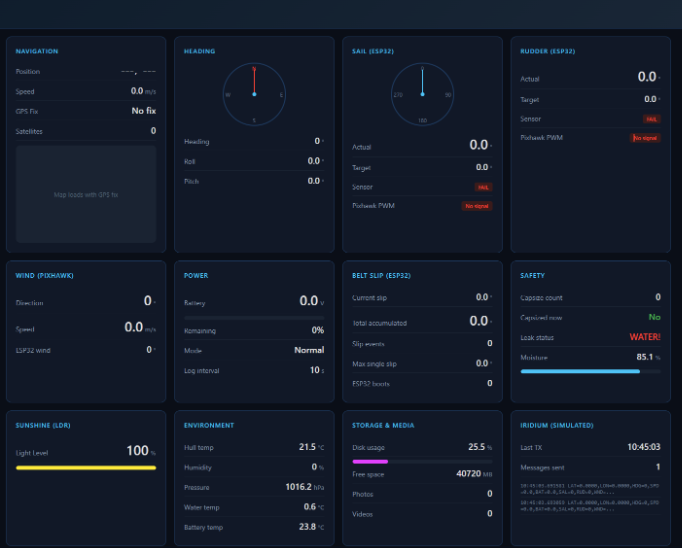
The dashboard has two main views:
- 01Navigation view: Live GPS position on a map, heading, speed over ground, battery voltage, ArduPilot mode (AUTO / MANUAL / HOLD), and a rolling log of MAVLink messages.
- 02Sensor view: Readings from all I2C devices — BMP280 (pressure, temperature), AS5600 (wind vane angle), DS18B20 (water temperature), and the PCF8591 ADC channels. Each sensor shows its last reading and timestamp.
I2C Bus
All the sensors share the same I2C bus on the Pi. BMP280 sits at 0x76, the PCF8591 ADC at 0x48, and the AS5600 encoder at 0x36. A second BME280 is planned at 0x77 for redundant atmospheric readings. The dashboard reads all of them in a single background thread and caches the values, so the API response is always instant regardless of sensor read latency.
# Reading BMP280 via smbus2
bus = smbus2.SMBus(1)
BMP280_ADDR = 0x76

def read_pressure():
    # trigger measurement
    bus.write_byte_data(BMP280_ADDR, 0xF4, 0x57)
    # read raw bytes and apply calibration...
    return pressure_hpa, temp_c
Cloudflare Tunnel
Flask runs on port 5000 on the Pi. Cloudflared creates a persistent outbound tunnel to Cloudflare's edge, which means the dashboard is accessible from anywhere in the world at sailone.org — no port forwarding, no public IP needed. During the Atlantic crossing, I'll be checking it from my phone the same way anyone else would access a website.
What's Next
The dashboard currently runs on the test vessel and is confirmed working with live GPS and sensor data. Next step is integrating the RockBLOCK 9603 Iridium modem so position updates keep flowing even when the boat is far offshore and Wi-Fi is gone. The plan is a heartbeat message every 10 minutes over satellite — enough to track progress across the full 970km without burning through airtime.